
See also


 19.10.2026 01:07 PM
Bitcoin tried to reclaim $83,000 today but failed again.
Meanwhile, US spot Bitcoin and Ether ETFs lost $549m last week, meaning investors continue to withdraw funds from the two largest crypto products. According to SoSoValue, Bitcoin funds saw outflows of about $229m, and Ether funds lost $320m. This is Bitcoin's second week of outflows and Ether's third.

The pace of outflows has eased a little. A week earlier the two fund types together lost $1.22bn, so the rate of withdrawal has more than halved. But a slowdown in outflows is not the same as demand returning: there are still no net purchases in the market, and that is why price lacks support. Notably, Ether is suffering more. Over seven days it fell about 5% to $2,433, while Bitcoin lost 1.3% and traded around $82,783. Looking at the month, roughly $955m left spot Ether ETFs since the start of October — more than in any other month this year.
I believe Ether will remain the weak link until ETF inflows at least return to a neutral balance: it is the asset that reacts most to institutional withdrawals. I also lean toward Bitcoin trading within the recent corridor in the coming days with attempts to break below $80,000, while Ether, without buyers, will likely retest support around $2,300. A reversal in flows will be the first honest signal that the market is ready to move off the defensive.
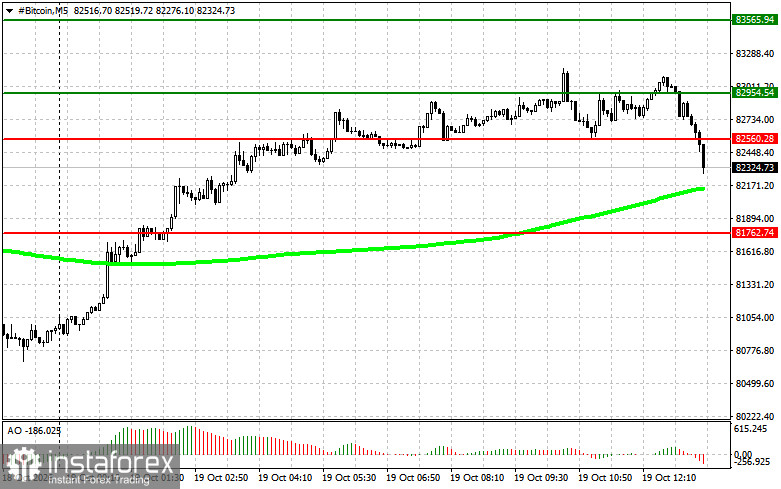
Technical analysis for Bitcoin. Price around $82,783 is trapped between $82,500 and $82,900, and the plan is built around two mirror directions with a full set of breakout and bounce scenarios. For long positions, I consider a break above $82,900 with a target of $83,500, where I would take profit and may flip into a short on the retracement, provided the price stays above the 50-day moving average and the Awesome indicator is above zero. If a drop below $82,500 fails and the price returns, buy the bounce, aiming first at $82,900 and then $83,500.
The sell scenario is symmetric. A confirmed break below $82,500 opens a short toward $81,700, but only when the moving average is above the price and Awesome is below zero. If a break above $82,900 fails and the price returns below that level, short the rejection targeting $82,500 and then $81,700.
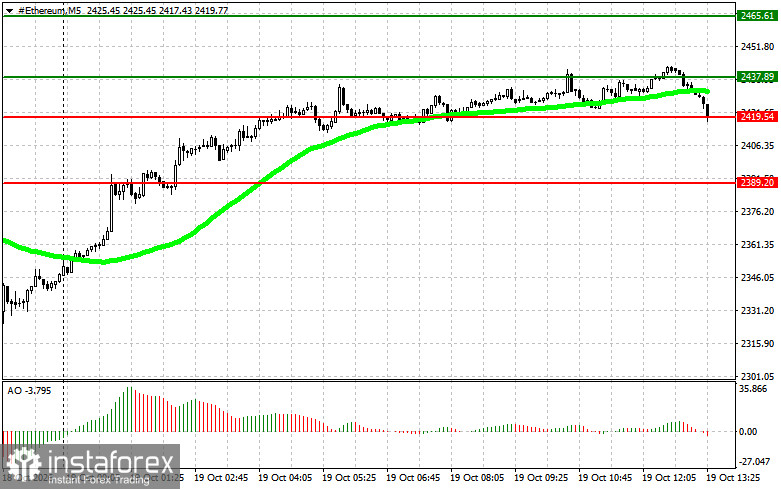
Technical analysis for Ether. The logic mirrors Bitcoin on its own price scale, with supports at $2,419 and $2,389 and resistances at $2,437 and $2,465. Buy on a break above $2,437, targeting $2,465, or buy the bounce from $2,419 after a false drop to target $2,437 and then $2,465. For sells, a confirmed break below $2,419 targets $2,389, or short the rejection from $2,437 after a failed upside breakout, targeting $2,419 and then $2,389. Both indicators serve as filters to weed out false moves, not as standalone entry triggers, so trades are taken only after price confirms the designated levels.


