
Vea también


 15.10.2026 05:26 AM
After two weeks of stagnation, Bitcoin has finally started to decline, as we expected. At this point, we can confidently say that at least a correction has begun. Recall that the downtrend has a real chance of ending, and it's not a small one. However, the reasons for a new sustained bull trend remain ambiguous and debatable. The recent three-month rise in Bitcoin was essentially a move from the lower edge of the sideways channel to the upper edge on the daily timeframe after a deviation formed at the channel's lower boundary and then a deviation at the upper boundary. The upper-boundary deviation was deep, but if it is indeed a deviation, Bitcoin may head toward $70,800 in the near term. After that, price would likely sit inside the flat again, and its prospects would remain uncertain.
Yesterday, the US September inflation report, to put it mildly, caused a stir across markets. US inflation accelerated to 3.7%, which is large in itself, but the market expected inflation to accelerate — to 3.6%. Thus the actual print was slightly above forecasts. In our view, nothing extraordinary happened yesterday. It was obvious that inflation would rise in September. That it rose to 3.7% rather than 3.6% absolutely does not change the Federal Reserve's policy outlook, at least through the end of the year. The Fed still looks set to tighten once more in December.
However, if the dollar has no solid reason to rally, Bitcoin has plenty of reasons to fall. The inflation report does not increase the probability of a materially stronger rate path, but it pushes the timing of any return to easing well into the future. Remember: risk assets do better the easier central-bank policy is. The Fed may not raise rates more than one additional time, and any move to easing is likely far off. Therefore, Bitcoin's decline is quite logical.
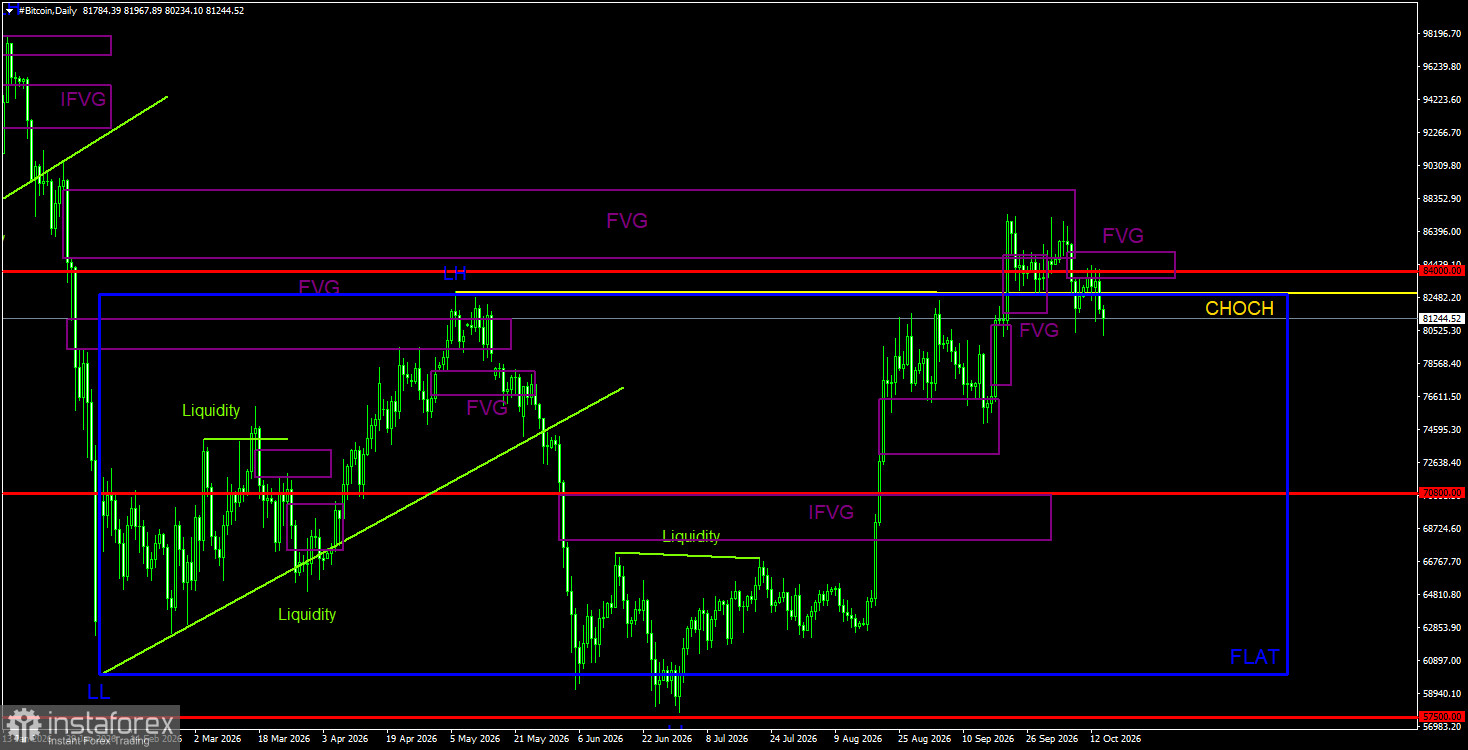
On the daily timeframe, the bearish trend structure has been broken, so most likely "digital gold" has officially moved into forming a new bull trend. Price filled the bearish FVG from the previous trend and reacted to that pattern, after which a correction began as expected. A breakout beyond the $60,000–$82,500 sideways channel could still be a deviation that, combined with the reaction to the bearish FVG, may provoke a drop toward the channel's lower edge. Thus, traders had grounds to open short positions. A new bearish FVG has also formed, triggering a sell signal.
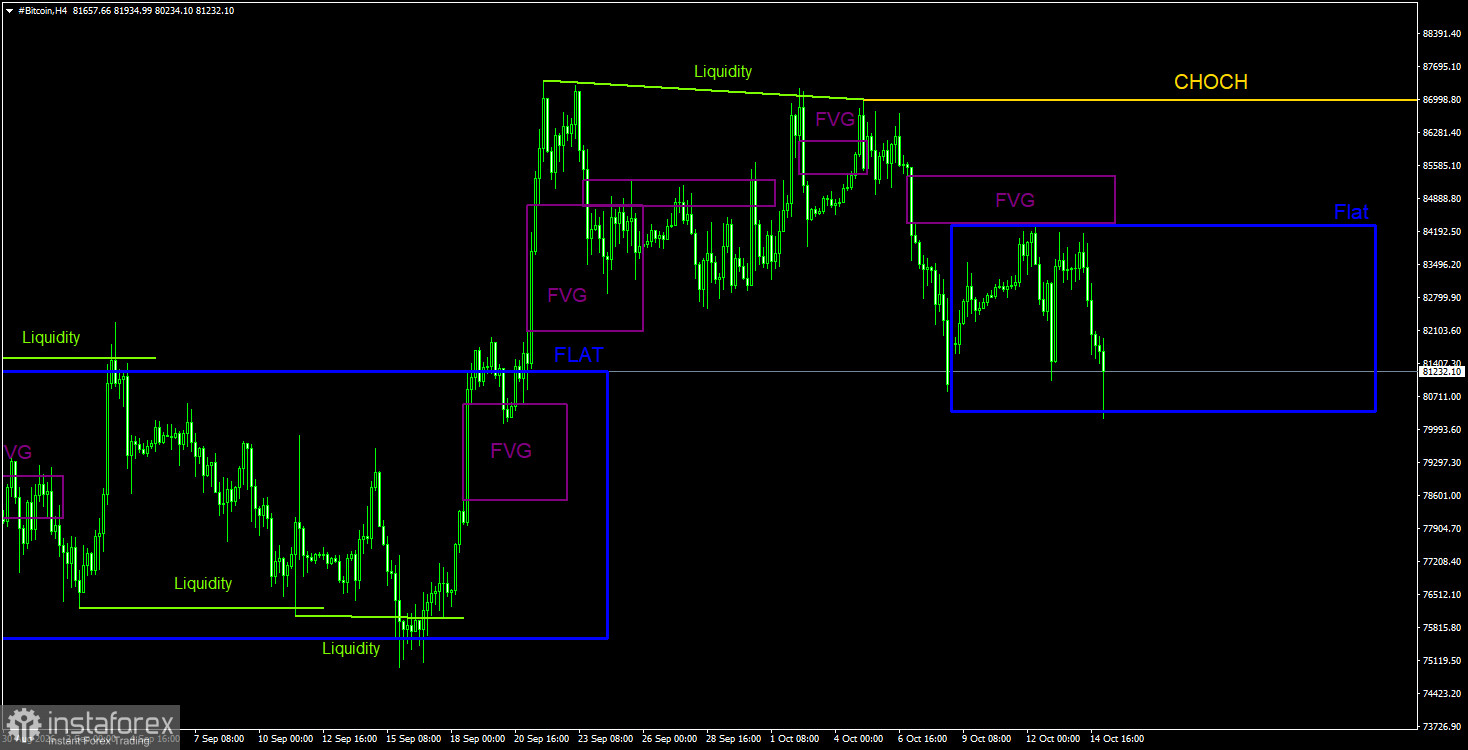
On the 4-hour timeframe, a bearish structure has started to form. The CHOCH line is currently at $87,000. On the daily timeframe, all necessary downward reversal signals appeared, allowing traders to open short positions. Bitcoin's targets are best defined by the sideways channel on the daily-chart, which we still view as relevant. On the 4-hour chart, the last bearish FVG triggered a price reaction that caused a new decline in the primary cryptocurrency. The only concern now is another flat and the removal of buy liquidity at the previous low. Bitcoin may spend some time inside the $80,400–$84,300 range.
Bitcoin shows signs of the start of a new bull trend. As often happens, this trend begins with a pump that lacks concrete, clear reasons. The Fed has not started easing, and the Clarity Act bill has not been passed. In the near term, on the daily timeframe, Bitcoin may still be declining, since price reacted to the bearish FVG and formed two sell signals. Also note that the breakout beyond the daily sideways channel may be a deviation — a deep deviation, but still a deviation. If that is the case, Bitcoin could head toward $70,800 and even retain the downtrend that began last year. We believe short positions are most relevant in the near term.


