
See also


 04.11.2026 05:54 AM
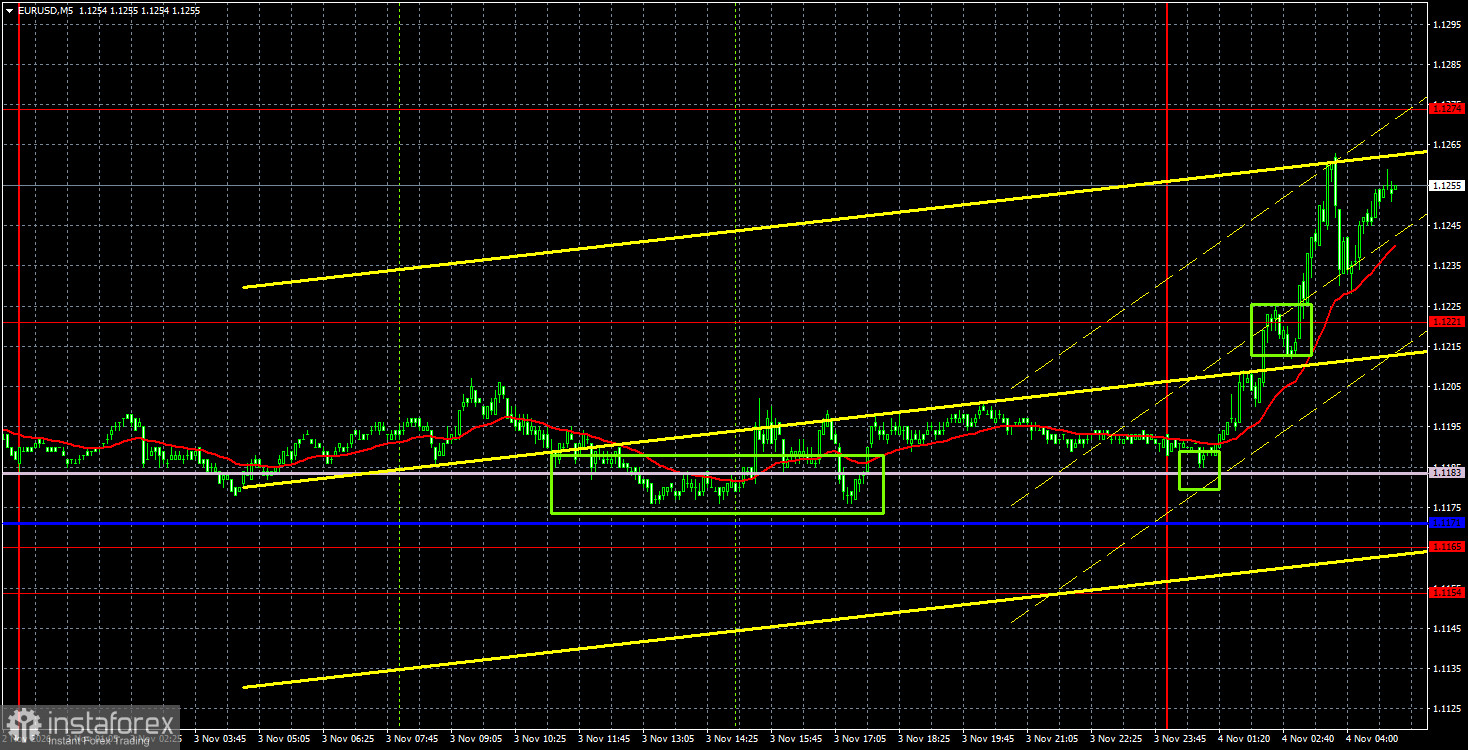
The EUR/USD currency pair showed no significant movements on Tuesday. The market traded sideways with low volatility throughout the day. This was quite understandable, as there were few important events on Tuesday, and the most significant one, the JOLTS report, was unlikely to trigger any market reaction under the current circumstances. It is worth noting that the number of job openings was significantly higher than the market had expected. However, as mentioned earlier, this report has never been particularly important to traders. The market prefers to assess the state of the US labor market based on Nonfarm Payrolls and the unemployment rate, both of which will be published on Friday.
Meanwhile, preliminary US election results have begun to come in. It should be noted that vote counting has not yet started in many states, while in others, no more than 10–20% of ballots have been counted. Therefore, the final results may differ significantly from the current figures. Nevertheless, at the time of writing, Democrats are leading in the House of Representatives by 121–68 and in the Senate by 45–36. In the House of Representatives, Democrats have already secured a four-seat advantage, which gives them the required majority. However, in the Senate, their advantage over the previous Congress amounts to just one seat. Thus, the current results are encouraging for the Democratic Party, although they are not entirely favorable. Few doubt that Democrats will win the House of Representatives, but securing a victory in the Senate will be difficult.
From a technical perspective, the downward trend may have come to an end, as a second descending trendline has already been broken. However, the price is still trading within the sideways channel of 1.1115–1.1261, so the outlook for the euro remains uncertain.
On the 5-minute timeframe, two buy signals formed on Tuesday, followed by another one overnight. Yesterday, the price rebounded twice from the Ichimoku indicator lines, and it did so for the third time overnight. Therefore, the euro may continue to rise. A possible Democratic victory in the elections is a negative factor for the US dollar.
The latest COT report is dated October 27. The weekly timeframe chart clearly shows that the net position of non-commercial traders remains bearish and declined significantly in 2026 due to geopolitical developments. Traders have been shifting away from the euro and toward the US dollar over the past eight months. Donald Trump's policies have not changed, but the dollar acted as a safe-haven currency for some time.
However, there are still no fundamental factors supporting further strengthening of the US dollar. The war in the Middle East temporarily made the dollar extremely attractive, while the Fed's monetary policy stance delivered another surprise for the dollar this year. In the long term, the euro could decline as far as 1.08 (the trendline), but the upward trend would still remain relevant. However, over the past few months, the market has been taking into account only the factors supporting the dollar while ignoring all others.
The positions of the red and blue indicator lines point to bearish dominance. During the latest reporting week, the number of long positions held by the Non-commercial group increased by 4,200, while the number of short positions rose by 13,600. Accordingly, the net position declined by another 9,400 over the week.
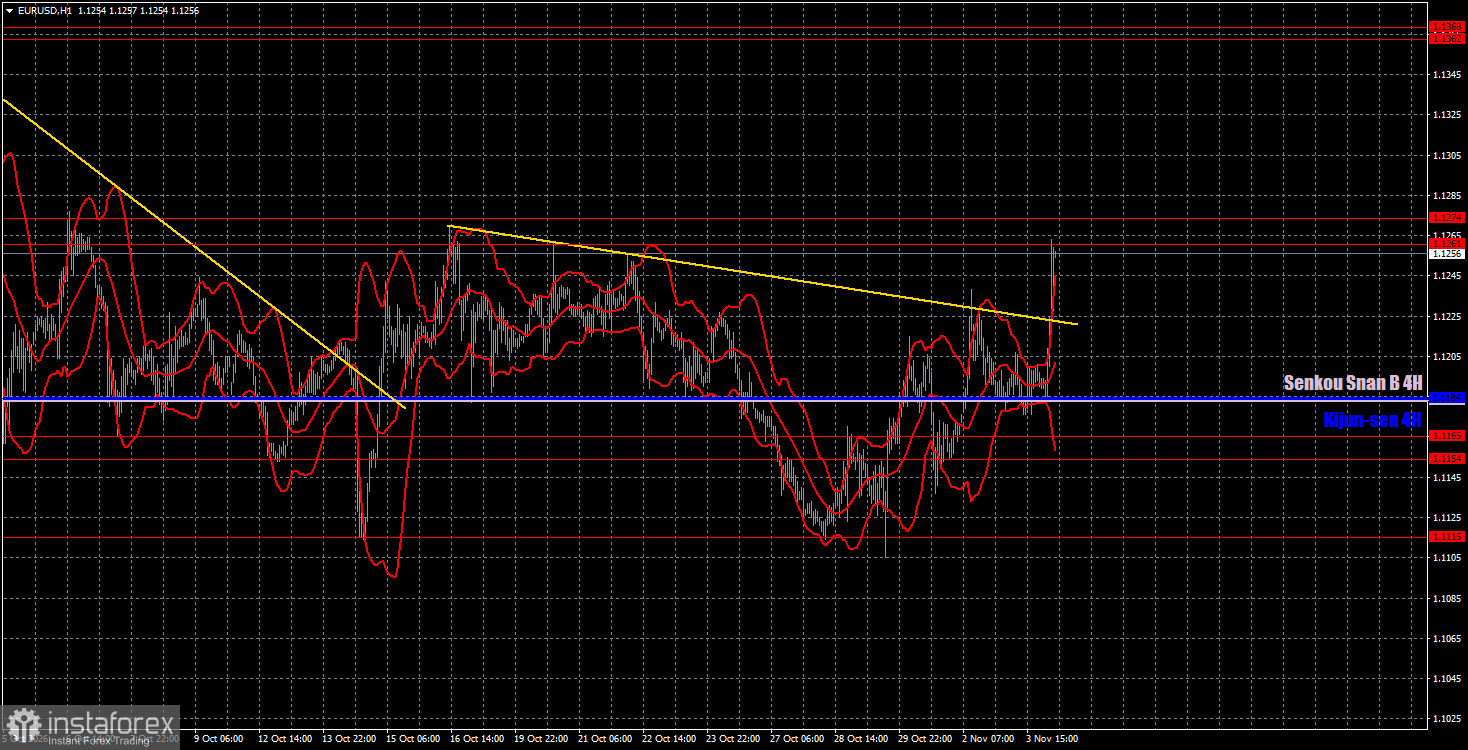
On the hourly timeframe, the EUR/USD pair has the potential to establish an upward trend, but it remains within a sideways channel for now. An examination of the daily and weekly timeframes makes it clear that the potential for a strong and prolonged trend remains high. However, for the euro to rise, market participants need to buy it. Over the past two months, there has been little evidence of any significant interest in buying the European currency. As long as the price remains within the sideways range, there can be no talk of an upward trend.
For November 4, the following trading levels are identified: 1.1006, 1.1115, 1.1154–1.1165, 1.1261–1.1274, 1.1362–1.1368, 1.1461–1.1473, 1.1536–1.1542, 1.1585, and 1.1657–1.1665, as well as the Senkou Span B (1.1183) and Kijun-sen (1.1184) lines. The Ichimoku indicator lines may shift during the day, which should be taken into account when identifying trading signals. Remember to move the Stop Loss order to breakeven once the price has moved 15 points in the right direction. This will help prevent potential losses if the signal turns out to be false.
On Wednesday, the European Union will publish its October inflation report, while the US will release the results of the congressional elections, along with the ADP employment report and the ISM Services PMI. Thus, at least four important events could trigger significant market movements today. High volatility is expected throughout the day.
Traders may consider short positions targeting the 1.1184 level if the price rebounds from the 1.1261–1.1274 level. If the price consolidates above the 1.1261–1.1274 level, the 1.1362–1.1368 level may be considered a target for long positions.
Support and resistance levels are shown as thick red lines around which price movements may end. These levels are not sources of trading signals.
The Kijun-sen and Senkou Span B lines are Ichimoku indicator lines transferred to the hourly timeframe from the 4-hour chart. They are considered strong lines.
Extreme levels are shown as thin red lines from which the price has previously rebounded. They can generate trading signals.
Yellow lines represent trendlines, trend channels, and other technical patterns.
Indicator 1 on the COT charts shows the size of the net position held by each category of traders.


